To answer that, we need to start off with what these capability indices represent.
Capability indices characterize a process as compared to a specification. Now the important thing about these capability indices is that they are calculated on the individual measurements, and all of the indices require a process that is in control in order to mean anything.
Capability indices are making a prediction about the ability of the individual measurements to conform to specifications in the future , and if your process is not in control, you don’t have any idea what it will do in the future. (“Control” in the statistical sense and as analyzed by a control chart is “stability and predictability.”)
WinSPC Means Lower Costs and Higher Quality
WinSPC is software to help manufacturers create the highest quality product for the lowest possible cost. You can learn more here.
*Technoid Note:
This is exactly the same thing as taking the z-score of the largest proportion out of the spec and dividing by 3. This is useful if the distribution is not normal. In that case, you need to model the distribution, find the equivalent z-score for the spec limits, and divide that by three. Luckily WinSPC does that for you!
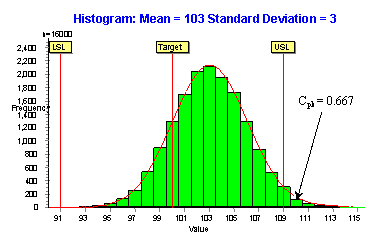
Cpk is a measure to tell us about our ability to conform to specification, since that is what we promised our customers we would do, and is related to how much of the process output is out of specification. If the process follows a normal distribution, Cpk is found this way:

where μ is the process average and s is the process standard deviation.*
If Cpk = 1, the process by convention has minimally acceptable capability, where if nothing changes you will have 99.73% of the product within specification. Few if any companies have a target Cpk of one, though, since if there is even the slightest change in the average you have an increasing probability of getting nonconforming output. The process in the histogram above averages one standard deviation off to one side, so it is not even minimally capable and the output will be nonconforming on average about 2.28%.

So the reason that your customer wants to know your Cpk is they want to know the probability of getting stuff from you that is in spec. If the Cpk is less than one, well this is usually a clue to your customer to get another supplier since you can’t make what you promised in the specification. If the Cpk is equal to one, your customer is probably not too thrilled either, since if there is even a slight process shift, you might be sending them out of spec stuff. They want to see a Cpk greater than one.
Many customers require that you have your processes in control and producing at a Cpk of 1.33 (called “in-control and capable”). This gives you one standard deviation of process drift (which is pretty easy to catch quickly with an xbar and r chart) before you even bump up against the spec.
That will make your customer happy since they are almost guaranteed of product that is in spec. And it will make your production folks happy since they will almost never have to scrap for being out of spec. Reporting your Cpk shows you and your customers your ability to conform to the specification limits.
Your ability to meet specification, however, is not the whole story. Quality product has minimal variation around the customer’s target and Cpk does not measure that. For that, you need another capability index called Cpm. Which we will talk about next time!
Steven Wachs, Principal Statistician
Integral Concepts, Inc.
Integral Concepts provides consulting services and training in the application of quantitative methods to understand, predict, and optimize product designs, manufacturing operations, and product reliability. www.integral-concepts.com
Download the white paper on how to jump-start a “mini” Six Sigma Quality program on a budget