Minimize loss from variation and non-optimal processes
To remain competitive, manufacturers must make high-quality products at the lowest possible price. WinSPC’s patented Cost Inspector™ advances this mission by analyzing processes for cost-saving opportunities. With it, Quality professionals expose hidden costs, costs not likely to be exposed in any other way, costs directly associated with give-away, overfill, rework, and scrap. The Cost Inspector works by applying process-specific cost models to captured process data and enables Quality teams to:
- Search through process data across all operations to uncover the most costly process problems
- Identify sources of greatest give-away, overfill, scrap, or waste
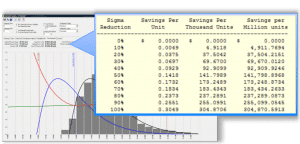
- Calculate how much can be saved per unit by reducing process variation
- Discover the optimal mean for each process and calculate how much can be saved by shifting a process’ actual mean to its optimal mean
Watch the Uncovering Hidden Manufacturing Costs video in the WinSPC Video Tour 
The Cost Inspector links cost information with data distributions to calculate which process improvements will save your company the most.
Deliver reports in terms that executives appreciate: dollars saved
Using the Cost Inspector™ technology, manufacturers can track and calculate the cost of process deficiencies in terms everyone can understand—dollars saved. This enables quality teams to win executive support for their programs, better prioritize their continuous improvement efforts, and establish a solid return on investment that proves the value of continuous improvement programs. Use the Cost Inspector to:
- Translate process improvement statistics into dollars saved for the company
- Produce cost-based reports to show executive management the return on investments in quality
- Deliver on-demand reports on daily, weekly, or annual savings from reducing variation and optimizing processes
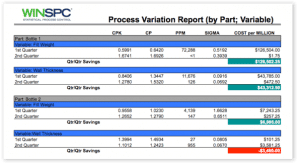
WinSPC’s Cost Inspector translates quality statistics into dollars, demonstrating the bottom-line savings from process improvement efforts.

Calculate dollars saved by reducing variation
WinSPC’s Cost Inspector allows quality professionals to search through process data using easily understandable filters to uncover valuable cost-based information on process variability. The Cost Inspector can highlight processes where variation is costing the most, or discover which processes are most responsive to variation reduction and have the potential for greatest savings. Quality professionals can use the Cost Inspector to:
- Identify costly increases in process variation that went unnoticed
- Calculate the hidden cost of variation for every process, plant-wide
- Discover which variation reduction efforts could produce the biggest savings return
The Cost Inspector quantifies savings from reducing variability, empowering quality professionals to undertake those reduction efforts that deliver the greatest bottom-line benefit.

Calculate dollars saved by shifting processes to optimal mean
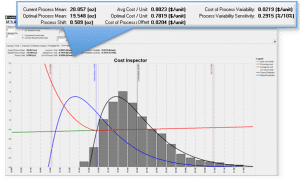
The Cost Inspector integrates manufacturing cost information with current data to identify the optimal target to manufacture a product at the lowest possible cost. The Cost Inspector displays a distribution curve alongside cost data – allowing quality teams to identify, visualize, and quantify the cost-savings potential of a process shift. With this view to savings, the Cost Inspector calculates the cost reduction possible by making adjustments to move a process toward the optimal mean. This enables quality professionals to find and extract excess costs from manufacturing processes. Use the Cost Inspector to:
- Calculate the cost from waste or give-away by operating at the current process mean
- Identify the optimal process mean for the lowest manufacturing cost
- Calculate the savings potential of shifting the process to its optimal set point
The Cost Inspector allows engineers to visualize process shift opportunities and the dollar savings associated with it.
Prioritize process improvement activities based upon the greatest potential for savings
The Cost Inspector calculates and displays the cost of process variability and non-optimal processes so that quality professionals can evaluate the cost/ benefit of particular process improvement programs. By identifying sensitivity to variability, the Cost Inspector helps determine which process will deliver the most savings from variation reduction efforts. The Cost Inspector also provides visualization of “low-hanging fruit” opportunities and hidden sources of product give-away, enabling manufacturers to effectively prioritize programs that bring the highest value to the organization. Quality professionals benefit by using the Cost Inspector to:
- Identify and prioritize process improvement programs based on cost savings potential
- Track and report on dollars saved through variation-reduction efforts
- Quantify savings from adjusting processes to the optimal mean
- Win program support from upper management based upon demonstrated cost /benefit analysis

Create an almost endless variety of cost-based manufacturing reports to:
- Prioritize continuous improvement programs
- Create cost-based improvement reports for executives
- Monitor the cost of process variation over time
- Provide up-to-the-moment manufacturing cost reports