Variables control chart pairs, which can be creating using SQCpack, illustrate central location and variability.
Analyzing for variability
To look for process variability, study the range, standard deviation (sigma), or moving range chart of the control chart pair. These will show how data points within the subgroup differ from each other. Interpret for variability first. If out-of-control conditions exist here, address them before continuing. Too much variability in the subgroups can be a difficult challenge, but until this variability is reduced, it does little good to work on the target or central location.
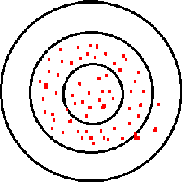
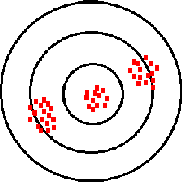
To understand this, consider a marksman. If the pattern of shot varies wildly, one time tight and another time loose, all the marksman can do is aim at the middle of the target and hope for the best (see Figure A). If he can tighten up the shot pattern, though, he can place shots to his choosing inside the target (see Figure B).

Figure A

Figure B
Analyzing for central location
Use the average (X-bar), median, or individuals (X) chart to analyze the central location of the process. This indicates where the middle of the subgroup is.
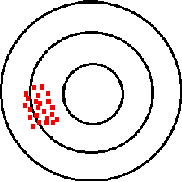
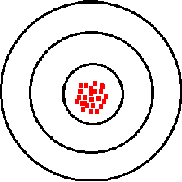
Here the marksman’s shot pattern is tight, showing little variability, but where is it placed in relation to the bullseye? Figure C shows the variability is tight or precise, but there is no accuracy. Figure D shows a marksman whose shots are both precise and on target or accurate.
If you are considering an individuals and moving range chart, keep in mind that you are looking at actual readings from the system, not averages or medians. Individual readings may not be normally distributed for a stable system. They may be skewed if the system is naturally bounded on one side. Characteristics such as flatness and timeliness are bounded by zero.

Figure C

Figure D