Quality Advisor
A free online reference for statistical process control, process capability analysis, measurement systems analysis,
control chart interpretation, and other quality metrics.

SPC DEMO
Minimize Production Costs, Quickly Detect Issues, and Optimize Your Product Quality
Don’t miss out! Book a demo of our specialized SPC software and unlock immediate improvements in your processes.
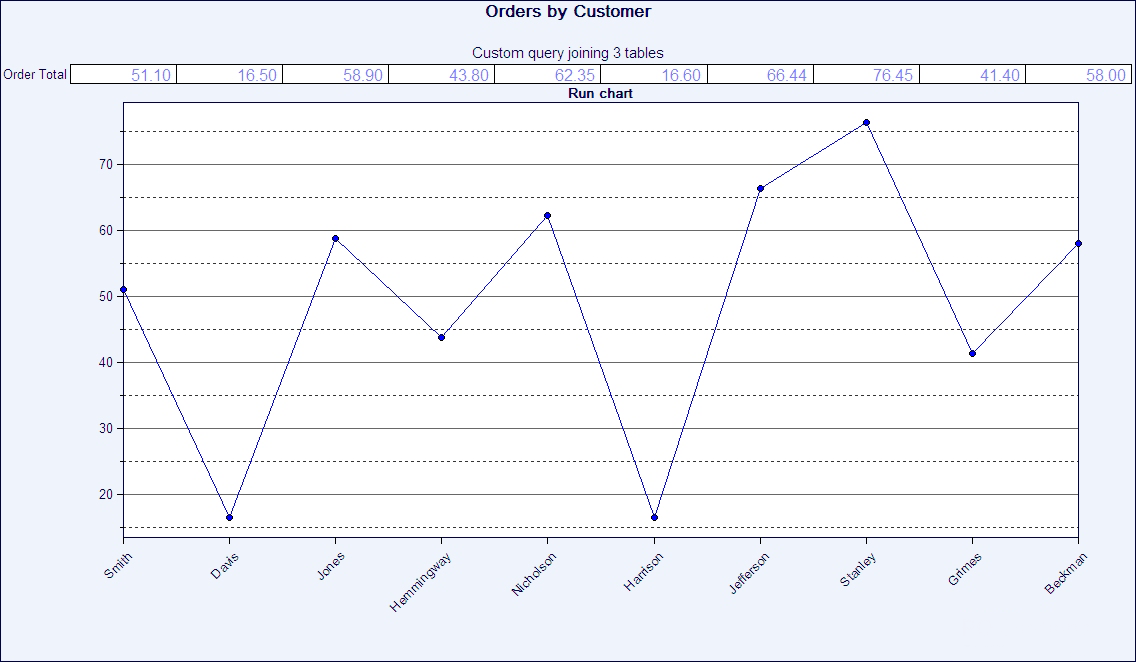
Run chart interpretation
To analyze run charts:
- Look for runs.
If you find seven or more points in a row rising or falling, you have found an unusual circumstance that calls for investigation. Finding evidence of a run is neither good nor bad. It simply raises a flag that says “ask why.” - Look for other nonrandom patterns.
You may find a repeating pattern that corresponds to other data. Any nonrandom or repeating pattern is cause for investigation. If you find no unusual patterns, you may notice differences among readings. Do they swing from highs to lows or are they quite similar to each other? Further analysis by control chart is the next likely step.
To create run charts that will highlight these patterns, use software such as SQCpack.