You have four charts and only one computer screen. How do you consolidate to a multiple chart view to compare data without having to thumb through individual charts? You might be tempted to resort to flashy, “Matrix”-style moves, but fear not, there is a simpler approach that is just as effective and doesn’t require stretching.
If you have attended our SPC Fundamentals training class or if you are familiar with our ProFicient SPC software, you know that we recommend viewing your data entry collection projects in Shop Floor Mode. This is a popular option because the chart icons and toolbar buttons are well organized, allowing you to view one chart at a time.
Graph 1: Shop Floor Mode
But how do you display multiple charts at once or take it a step further and strategically align the charts? When facing this challenge during a recent on-site visit, I found this solution.
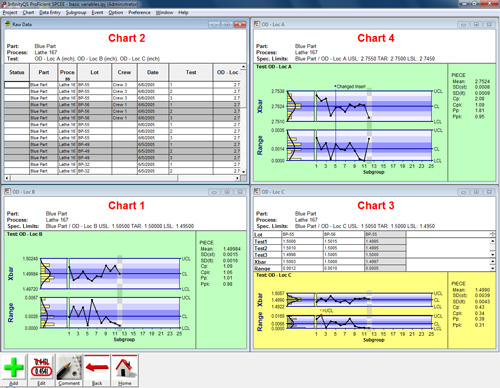
To view all charts in a tiled configuration (Engineering Mode), click Preference | Project | Special in the ProFicient SPC menu bar, and under the Display Mode tab, uncheck the Shop Floor Mode option. ProFicient SPC reorganizes the charts into a cascaded Engineering Mode, and you will have to tile them horizontally or vertically (in the ProFicient SPC menu bar, click Window | Tile Horizontal or Window | Tile Vertical) to position the charts as shown below.

Graph 2: Engineering Tile Mode
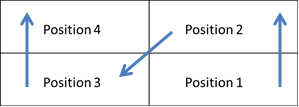
If you want to reorganize the charts in a specific way (Chart 1 upper left, Chart 2 upper right, Chart 3 lower left, and Chart 4 lower right), you could click and drag each chart into place, but there’s a little more to it than that. In the table below, examine the steps for reorganizing a 2×2 matrix of charts:

Table 1: 2×2 Matrix
To accomplish this reorganization, you must position the charts in a specific order, and be sure to select all of the charts. If you only select some of them, they could be misaligned when you tile.
- Click the chart you want in the lower right hand corner (Position 1).
- Click the chart you want in the upper right hand corner (Position 2).
- Click the chart you want in the lower left hand corner (Position 3).
- Click the chart you want in the upper left hand corner (Position 4).
- In the ProFicient SPC menu bar, click Window | Tile Horizontal or Window | Tile Vertical.

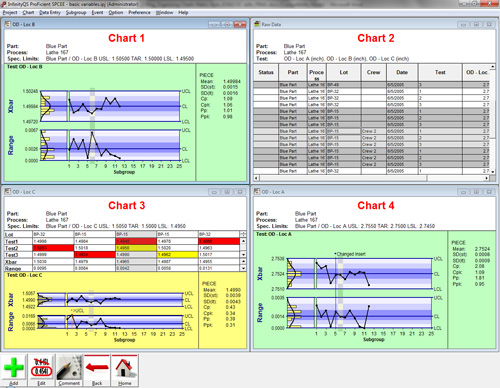
Graph 3: Engineering Tile Mode – Post Matrix
Once you are satisfied with the chart organization, click Preference | Project | Special in the ProFicient SPC menu bar, and under the Display Mode tab, check the Lock Charts option. This will prevent further movement of the charts.
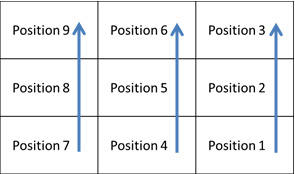
Of course, you may need to rearrange more than four charts. For example, how would you manage a 3×3 matrix? In fact, it works similarly.

Table 2: 3×3 Matrix
- Click the chart you want in lower column 3 (Position 1).
- Click the chart you want in middle column 3 (Position 2).
- Click the chart you want in upper column 3 (Position 3).
- Click the chart you want in lower column 2 (Position 4).
- Click the chart you want in middle column 2 (Position 5).
- Click the chart you want in upper column 2 (Position 6).
- Click the chart you want in lower column 1 (Position 7).
- Click the chart you want in middle column 1 (Position 8).
- Click the chart you want in upper column 1 (Position 9).
- In the ProFicient SPC menu bar, click Window | Tile Horizontal or Window | Tile Vertical.
It’s just that easy, and you didn’t even pull any muscles.