The perennial answer is, of course, “It depends.”
For decades of users, Shewhart control charts have provided information about process stability. Like all Shewhart charts, data is plotted over time and in order from oldest to most current. The traditional control chart, an old standby, is not the only possibility when it comes to garnering information from process data. In monitoring processes with small drifts or changes, for example, the exponentially weighted moving average (EWMA) chart may offer an improvement over traditional Shewhart control charts.
But again, that depends. Certain processes—for example, in the chemical industry—benefit from understanding small shifts or drifts in a process. For other industries, Shewhart control charts do the job quite effectively.
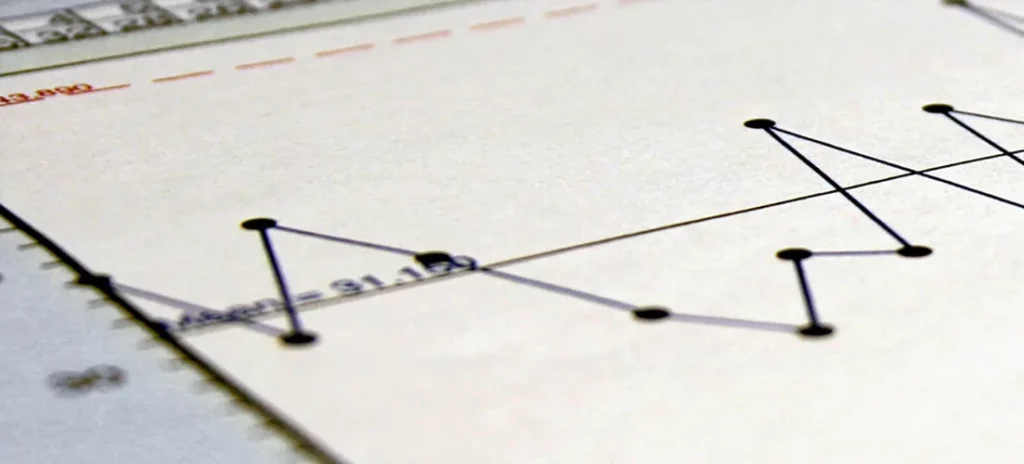
An EWMA chart is a revised form of a traditional control chart. There may be advantages and disadvantages to looking at your process data using an EWMA chart. Both EWMA and traditional Shewhart control charts are used for either variables or attributes data. The advantages lie in the application. Where it is important to track gradual shifts in a process or to compare to target values, EWMA may be an effective chart to use. If you are not familiar with an EWMA chart, it is similar to a Individuals or X-bar chart. However, each plotted point on the chart is comprised of a combination of the current measurement and a weighting factor from previous values. The concept is that the previous observations have some influence or weight on the current value. For example, if your measurement is 100, the EWMA chart may plot the observation less than 100 if previous values were less than 100. Since the previous values are lower, they “weigh” the current observed value lower.
While not everyone agrees with the use of EWMA charts, these charts offer some potential advantages. They:
- may offer a quicker signal to detecting small changes than traditional Shewhart control charts;
- are best at comparing data to target values, to understand when a process has drifted off target;
- utilize upper and lower control limits to determine when a sample is out of control;
- can be used with individual or subgrouped data.
Disadvantages: EWMA charts:
- may not be any better than Shewhart control charts at detecting out-of-control conditions for some processes;
- may in fact be less effective in detecting out-of-control conditions;
- are more complex and demand additional statistical understanding;
- offer no advantage in analyzing certain processes (e.g., those with larger process shifts rather than subtle changes).
- are difficult to create unless SPC software is used.
Complexity of the chart may represent the most dramatic hurdle to applying it to a process. But wait. You will not need to learn additional formulas or understand complex applications, since the complexity is all handled by SQCpack 7, which now offers the EWMA chart without creating more complexity for those who choose not to use it.
So while you ask yourself other questions about your data (attributes or variable? sample/subgroup size? etc.), consider the process that you are observing, the kind of data that it produces, and whether EWMA charts will offer additional information you are seeking.