How Do You Use Target IX-MR Charts?
Target charts show multiple characteristics that have different nominal or target values, with a zero point representing the target value of each characteristic. Target individual X and moving range (IX-MR) charts enable you to spot variation in a characteristic and plot several characteristics in the same chart. Review the following example—an excerpt from Innovative Control Charting1—to get a sense of how a target IX-MR chart works.
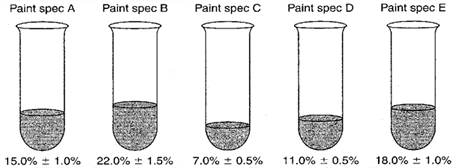
Figure 1. Target percent solids from five different paint specifications.
Case Description
Solids content in paint is a key characteristic. To obtain a measure of solids content, a paint sample of known weight is taken from a mixing tank—one sample per paint batch. The sample is baked in an oven until only solids remain. The remaining solids are weighed and a percent solids is calculated. In this example, a mixing tank is used to produce five different types of paint: A, B, C, D, and E. Each paint type requires a different percent solids content. Long production runs rarely occur with any one paint. The production manager is monitoring the solids content from all five paints on the same SPC chart.
Bring SPC Charts Up to Speed
This example provides a deep dive into the manual calculations behind the target IX-MR chart. InfinityQS® solutions—ProFicient™ and Enact®—automate chart creation and help you optimize processes faster.
Sampling Strategy
A target IX-MR chart is used to monitor this process because
- Only one characteristic is being controlled (solids content).
- One measurement is representative of each batch.
- The user prefers to construct a single chart to track multiple paint specs.
Data Collection Sheet
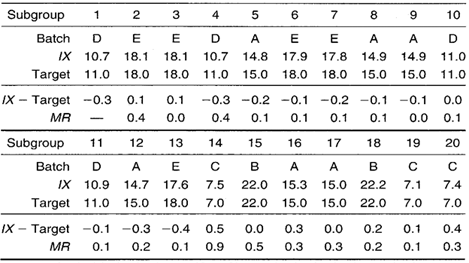
Table 1. Data collection sheet for constructing target IX-MR chart.
Target IX-MR Chart
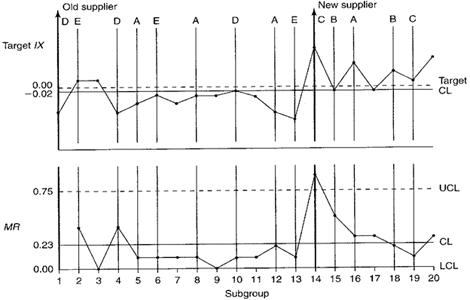
Figure 2. Percent solids target IX-MR chart.
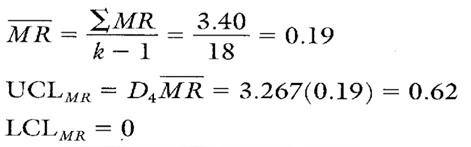
Calculations for the MR Chart
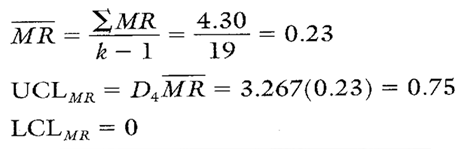
Calculation 1. Calculations for MR chart.
MR Chart Interpretation and Recalculation
An upward spike occurs on the MR chart when the new supplier’s products begin to be used. Because the MR chart is out of control, this means that the value of MR is unreliable and cannot be used to calculate control limits for the target IX chart. This is why no control limits were placed on the target IX chart in Figure 2.
After removing the out-of-control plot point (subgroup number 14) from the MR chart, the MR was recalculated using the remaining 18 MR values (see Calculation 2).
Calculation 2. Revised MR chart calculations after removing subgroup number 14.
Note that all of the remaining moving range values fall within the new MR chart control limits (see Figure 3). There appears to be no indication of assignable causes of variation. Given this situation, it is now appropriate to complete the control chart calculations for the target IX chart.
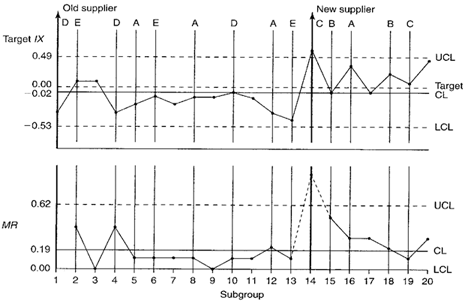
Figure 3. Target IX-MR chart with revised control limits. Subgroup number 14 has been removed from calculations for the MR chart.
Calculations for the Target IX Chart
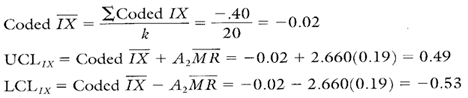
Calculation 3. Calculations for the percent solids target IX chart.
Target IX Chart Interpretation
It appears that, after the supplier change, the percent solids contents increased across paints A, B, and C. The run above the centerline between plot points 14 and 20 was determined to be the result of changing the supplier. The run below the centerline between points 4 and 9 is, in part, due to the upward shift in the centerline between points 14 and 20.
Note: When analyzing target charts, also look for patterns unique to each characteristic represented on the chart. For example, look to see if all of paint A plot points were above or below the centerline or trending upward or downward. In this example, all paint B plot points are above the centerline, but there are only two plot points. This does not qualify as an assignable cause. However, if eight or more plot points from the same paint were above the centerline, it would indicate an out-of-control condition unique to that paint. This would be true regardless of how many different paints were manufactured between those points.
Recommendation
Supplier changes should not be introduced into the line without first knowing how the change will affect the producibility and/or the finished product. If the effects are known in advance, prior adjustments can possibly be made without affecting the production line. In many cases, the costs associated with changing suppliers exceed the benefits of a lower price.
Estimating the Process Average
The coded IX on the control chart (–0.02 percent) has been upwardly influenced because of the supplier change assignable cause. Because of the presence of an assignable cause, the overall average of –0.02 percent is not a reliable estimate of the centering of the process.
To accurately estimate the overall process average, we will evaluate only the data from the old supplier (the first 13 subgroups). This data by itself proved to be in control on a separate target IX-MR chart (not shown here).
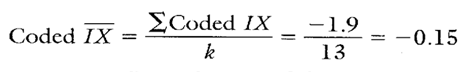
Calculation 4. Estimate of the process average based upon old supplier data (first 13 subgroups).
The coded IX from Calculation 4 shows that, on average, each old supplier batch of paint is approximately 0.15 percent below targets. If enough data were gathered from the new supplier data, it might be interesting to evaluate the old supplier’s coded IX with the new supplier’s IX.
Estimating Sigma
The MR chart for the first 13 subgroups (not shown) proved to be in control. The calculation for MR is shown in Calculation 5.
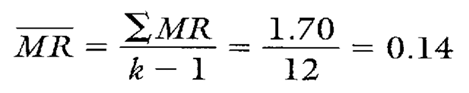
Calculation 5. Average moving range calculation from first 13 subgroups.
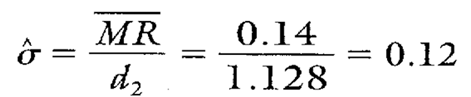
Calculation 6. Estimating sigma using MR from Calculation 5.
Note that the first 13 subgroups represent only old supplier data. Therefore, the sigma found in Calculation 6 can be thought of as the estimated standard deviation for the old supplier. Notice, though, that the first 13 subgroups also are representative of process performance from paint specs A, D, and E. No data representing paint specs B or C are found. Therefore, paint specs A, D, and E will be used in calculating Cp and Cpk values. There will be no calculation of Cp or Cpk values for paint specs B or C.
Calculating Process Capability and Performance Ratios
Capability ratios will be calculated for each paint specification found in the first 13 subgroups. Because the MR chart is in control, the same sigma may be used in calculating process capability and performance ratios for paint specifications A, D, and E. The Cp calculation for paint specification A (assuming the old supplier’s materials are used) is found in Calculation 7.
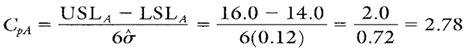
Calculation 7. Process capability ratio for paint spec A using old supplier data.
In order to calculate CpkA, the process average must first be estimated for paint spec A. The estimate of the paint spec A process average is given in Calculation 8.
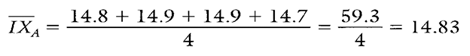
Calculation 8. Estimate of the process average for paint spec A.
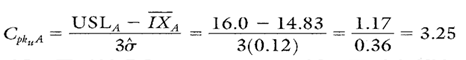
Calculation 9. Cpk upper calculation for paint spec A.
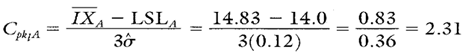
Calculation 10. Cpk lower calculation for paint spec A.
Because the Cp value is greater than 1, the process is more than capable of producing almost 100 percent acceptable output. Because the Cpk value is smaller than the Cp value, it means that the process is a little off center, but because the Cpk value is larger than 1, the process is performing to specifications.
The Cp and Cpk ratios for paint specs D and E can be found in Table 2.
Note: To ensure reliable estimates of sigma and the process average, one needs about 20 data points. Therefore, the calculations on these pages and those in Table 2 are used for illustration purposes only.
Target IX-MR Chart Advantages
- Multiple parts, specifications, or characteristics can be plotted on the same chart (provided they all have similar variability as exhibited by an in-control MR chart).
- Cp and Cpk can be calculated for each characteristic on the chart.
- Statistical control can be assessed for both the process and each unique part and/or characteristic on the chart.
Target IX-MR Chart Disadvantages
- When interpreting the target IX chart, both the zero line and the coded X must be taken into account.
- The MR plot points are dependent on the IX plot points. In other words, changes in the MR chart are directly related to changes from one individual measurement to the next.
- Variation in the individual measurements could be caused by a shift in the average or the inherent standard deviation of the process; however, the IX-MR charts cannot efficiently separate the effects of the two.
- Reliable control limits require the distribution of the individual measurements to be approximately normal.
- The target IX-MR chart is not as sensitive to changes in the process average or standard deviation as would be a target Xbar-R chart.
Additional Comments About the Case
Cp and Cpk for paint specifications D and E are shown in Table 2.
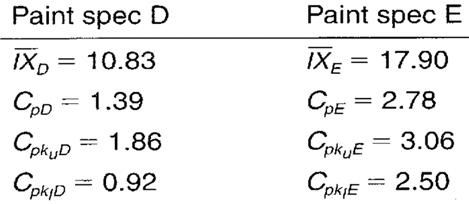
Table 2. Cp and Cpk values for paint specifications D and E.
FOOTNOTE: 1 Wise, Stephen A. and Douglas C. Fair. Innovative Control Charting: Practical SPC Solutions for Today’s Manufacturing Environment. Milwaukee, WI: ASQ Quality Press.