Master Calibration: How GAGEpack Helps Quality Heroes Maintain Precision
Every Quality Hero knows that even the smallest measurement errors can have a big impact on product quality, compliance, and operational efficiency. Keeping your gages properly calibrated isn’t just a best practice—it’s the foundation of consistent, high-quality production. But managing hundreds (or thousands) of gages manually? That’s a challenge even the best teams struggle with. … Continued
Gage Management: Streamline Your Gage and Calibration Processes
In precision-driven industries, accurate measurements are critical for maintaining quality and compliance. Advantive’s Gage and Calibration Management solutions provide the tools you need to efficiently manage your gages, ensure reliable calibrations, and maintain compliance with industry standards. With a centralized platform, you can stay audit-ready, minimize downtime, and improve measurement accuracy while reducing risks associated with poorly maintained equipment.


Key Benefits of Our Gage and Calibration Management Solutions
Discover how our solutions deliver measurable improvements in calibration accuracy, compliance, and operational efficiency. From automated calibration reminders to advanced reporting, these key benefits ensure your team stays organized and informed.

Features Designed to Elevate Quality Management
Our gage and calibration management solutions offer powerful features to simplify operations and ensure quality. From centralized tracking and scheduling to advanced analytics, these tools help you stay ahead of challenges.

Why Choose Advantive for Gage and Calibration Management?
Advantive brings proven experience, customization options, and seamless integration to help manufacturers achieve their quality goals. Learn why industry leaders trust our solutions for managing their gage and calibration processes.
With decades of experience in quality management, Advantive provides a complete calibration management solution tailored to your industry’s needs.
Customer Success Stories
Find out how our customers are solving plant floor problems, minimizing production costs, and maximizing customer value with best-of-breed SPC software from Advantive.
What to Expect
- Free 20-minute call with a product expert
- Live demo tailored to your industry requirements
- Discover what products best fit your needs
- No games, gimmicks, or high-pressure sales pitch

Case Study
Learn how the nation’s largest manufacturer of light-duty all-terrain vehicles and snowmobiles expanded and improved quality across its supply chain using SQCpack.
Ensure Measurement Accuracy and Reliability
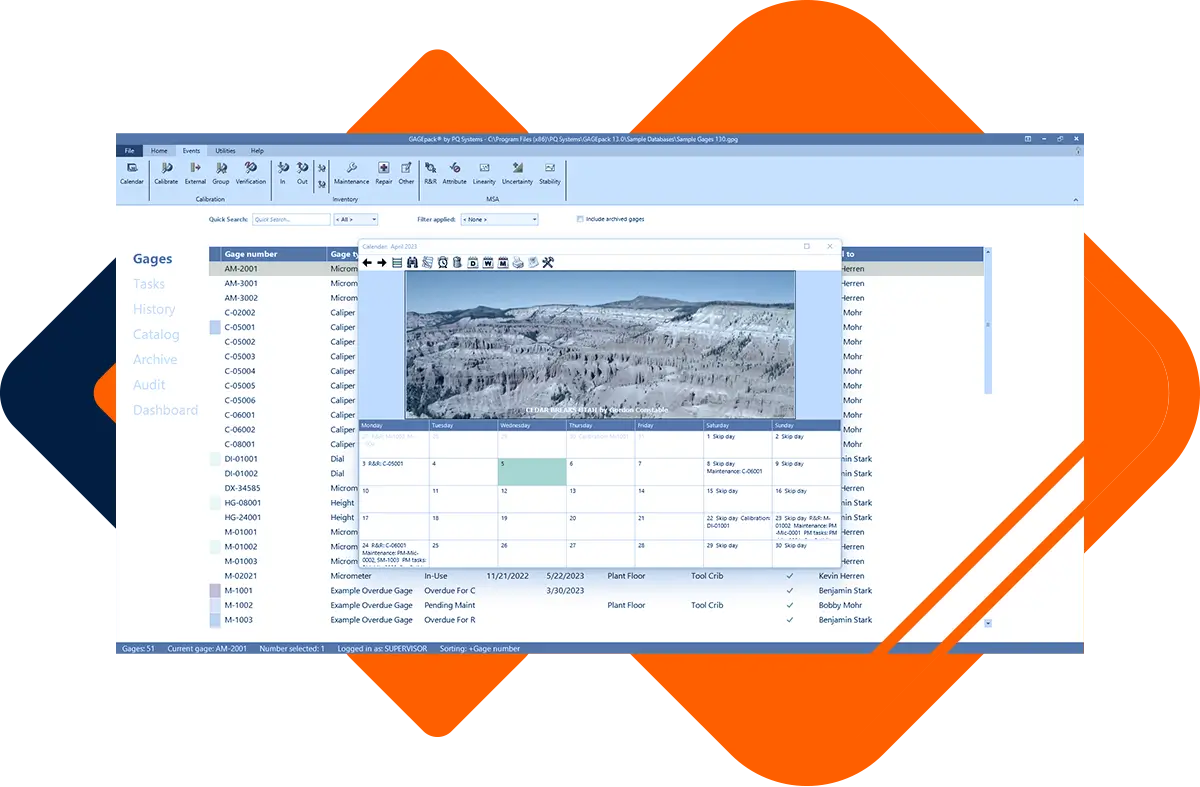
GAGEpack from PQ Systems offers a powerful and intuitive solution for managing gages and measurement devices. Designed to streamline calibration, improve accuracy, and ensure compliance, GAGEpack is the trusted choice for manufacturers who need reliable tools to manage their quality processes.
Key Features of GAGEpack Gage Management Software
Comprehensive Gage Tracking
- Maintain a complete inventory of your measurement devices.
- Track gage location, usage, and history with ease.
Automated Gage Calibration Management
- Schedule, monitor, and document calibrations effortlessly.
- Receive notifications for upcoming or overdue calibrations.
Improved Data Accuracy
- Reduce errors with automated data entry and tracking.
- Ensure consistent and accurate measurements across your operations.
Compliance Support
- Meet industry standards and regulatory requirements with detailed reporting.
- Simplify audits with comprehensive, easily accessible records.
Cost Reduction and Efficiency Gains
- Minimize downtime with optimized gage utilization.
- Lower costs associated with gage repair and replacement.

How GAGEpack Gage Management Software Benefits Your Operations

- Streamline Calibration Processes Eliminate manual tracking with automated scheduling and reminders to ensure your gages are always ready for use.
- Boost Operational Efficiency Save time and resources by centralizing gage data and optimizing calibration schedules.
- Ensure Compliance and Reliability Gain confidence during audits with detailed, accurate, and organized records that meet industry standards like ISO 9001 and IATF 16949.
- Minimize Measurement Errors Track gage performance and reliability to reduce variability and improve production outcomes.
Why Choose GAGEpack?
- Ease of Use Intuitive interface designed for efficiency and simplicity.
- Flexibility Customizable features and reporting to meet your specific needs.
- Proven Reliability Trusted by thousands of manufacturers worldwide for gage management.
- Comprehensive Support Benefit from PQ Systems’ expert training, consulting, and customer support.

What to Expect
- Free 20-minute call with a product expert
- Live demo tailored to your industry requirements
- Discover what products best fit your needs
- No games, gimmicks, or high-pressure sales pitch
Uncover the Truth About Capability Analysis
Dive into the complexities of capability analysis with our insightful whitepaper, CPK: Indispensable Index or Misleading Measure?. This essential resource explores whether the capability index (Cpk) is truly indispensable or potentially misleading, providing you with the knowledge to make informed decisions in your operations. Authored by industry expert Steve Daum, this whitepaper delves into the … Continued
