- Can repeatability be less than reproducibility if three appraisers are used?
- On an R&R study, if I use the specifications, the study is good. If I use the study parameters, the gage fails.
- R&R percentages don’t tell you how well repeatability is centered. Is it possible to apply Cpk principles to the estimated deviation to determine margin to the spec limits?
- What are Process X-double bar and Process R-bar used for?
- What is the difference between tolerance and process variation
- What kind of set-up would you recommend for testing one instrument?
- What are the objectives of an uncertainty study
Can repeatability be less than reproducibility if three appraisers are used?
Repeatability and reproducibility are relatively independent. The desired reproducibility is zero and this would essentially mean that the appraisers are measuring the same average value. That is, one appraiser is not measuring parts on the average as larger than the other two appraisers are.
On an R&R study, if I use the specifications, the study is good. If I use the study parameters, the gage fails.
In AIAG’s Measurement Systems Analysis manual, the standard approach for R&R percentages is to use percent of study variation. This means that the parts selected for the study are used to estimate the product’s variation (more correctly the product’s process variation). This makes the selection of those parts critical to the analysis. You want to know if your measurement system can detect changes in the process and tell if the process goes out of control.
The prior methodology asked a different question: Can I tell whether a product is good or bad. This is an inspection mentality that the automotive manufacturers want to move away from. In this case, the percentages are based on dividing by the specification range.
My general suggestion is to use the percent of study variation. However, given the push to improve Cp and Cpk, we have reduced the variation in our processes considerably. In some cases, we have Cpk’s > 2. In most of these cases, the R&R percentage will be poor because of the reduced variation in the processes. We can improve our measurement system (many times at great cost and sometimes we cannot improve it), but it will not result in a better product. So a suggestion that I frequently make is to specify some Cpk level above which you use R&R percent of tolerance and below which you use R&R percent of study.
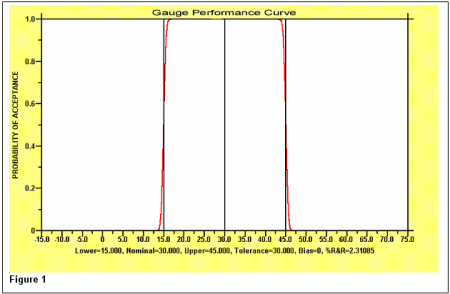
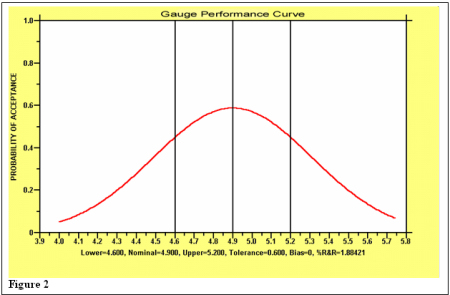
R&R percentages don’t tell you how well repeatability is centered. Is it possible to apply Cpk principles to the estimated deviation to determine margin to the spec limits?
When doing an R&R study, you are checking to see if the variation in the measurement is too large to measure a product dimension in reference to either process variation or specification spread. There is no attempt in the R&R study to determine bias. This is done through a linearity or bias study. Without a true “measurement” for each part used in the study, centering cannot be determined and it can vary based on measurement size. Cpk is targeted to how well you are meeting a single value (normally the nominal or target value).
What are Process X-double bar and Process R-bar used for?
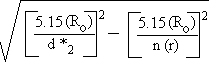
There are two ways to do R&R: One is to do the percentages with respect to tolerances (spec spread). The other is to do the percentages with respect to process spread (5.15 sigma). There are two ways to estimate process spread. The first is to do it from the parts used in the study. The second way bases process spread on control chart information from the process. Process  and Process
  are used in the second method. GAGEpack is able to do R&R both of these ways.
What is the difference between tolerance and process variation?
The major difference between the two approaches relates to the purpose for doing the study. In the past, most companies were concerned only with getting good parts. Being able to sort parts (good from bad) was the requirement for the gage. Now most companies require their suppliers to have controlled, capable processes. If you are going to control a process, you need to be able to detect changes in the process (out-of-control conditions). Therefore, the recommended approach uses process variation based on the parts used to do the study. GAGEpack, gage management software, allows you to also estimate the process variation based on a control chart for the process measurement being studied.
The push to improve processes by improving the capability ratios is a complicating factor. This reduces the variability of the process. As a result, many gages do not pass the R&R % required. Often, the alternative comes down to purchasing a “better” measurement system (often a very expensive gage). In some cases, better systems do not currently exist. In any event, there is some question as to the value of improving the measurement system. In cases where Cpk > 2 (or whatever number you like), the customer is not likely to notice any improvement and the cost of producing (measuring in particular) increases. (Side Note: a frequently used major criteria for selecting improvement project is: Will the customer notice the improvement? Will it make a difference to the customer?) In this case, one might want to consider a policy of using tolerances for situations where Cpk is greater than some value, with the stated objective of applying their improvement efforts to situations where the process is not capable and the potential for improvement is greater.
What kind of set-up would you recommend for testing one instrument?
It measures percent acidity. There are six analysts who use the instrument to test acids whose strengths range from 50% to nearly 100%. I could have each analyst run the same of several samples in triplicate. I could fix the sample weights + or – 0.1 gram.
Answer:
It depends on what you are trying to accomplish. To some extent, R&R studies may not be appropriate. One objective would be to see how the gage accuracy varies over the relevant range (50% to 100%). You can do this with a linearity study. The major difference is that the parts used for the study are different products with values that range throughout the gage range, e.g., 55%, 65%, 75%, 85%, & 95%. You need reference values (true values) for each product. These can come from certified samples (like using gage blocks) or from using a “super” gage with better known accuracy. Since you are using different products, the traditional R&R percentages do not mean anything. However, if you wanted to test if the appraisers are measuring things differently, you could use more than one operator and check the operator bias and the operator uncertainty results.
If you want to run a traditional R&R, I would suggest picking a concentration where most of the tests are run. You can use all six operators in the same study. Given the previous results, I would suggest this as well, providings it does not overcomplicate the running of the tests. Here the samples (5-10) need to come from one product, but have values typical of the total range of the product variation. Two or three replications should work fine. This would allow you to check the gages’ ability to discriminate among the values for the product and to evaluate the performance of the operators. Linearity could not be checked for the gage, however.
What are the objectives of an uncertainty study?
The objective of an uncertainty study is to put bounds on a measurement (x plus/minus some interval). Generally a 95% confidence interval and the t-distribution is used since there are not a lot of observations taken. To do the study use one gage, one part, one part characteristic, and one operator. The characteristic is measured on the part a number of times-10, 15, 25, etc. A standard deviation is calculated (that should be all measurement error), and the appropriate t value obtained and multiplied times the standard deviation. This becomes the plus/minus interval estimate about the measured value (uncertainty).
If you would like a bias estimate using this same data and have a reference value for the part characteristic used, you may place it in the reference block and the program will take the mean of the measurements and subtract the reference value to give an average bias value.
If you would like the bias expressed as a percent of specification or percent of process variation, you enter the USL, LSL and/or six sigmas for the spread of the process (generally obtained from an X-Bar and Range chart on the process), and the respective percents will be calculated.
I am not aware of any guide lines that have been given for these values. When you do a calibration, there is a plus/minus interval that is acceptable. This might be one source for determining acceptable values for both uncertainty and bias values. When you do an R&R, there are guidelines for the percent R&R. This may provide input into development of acceptable percentages.
Start implementing MSA today. Download a free trial of GAGEpack.